Factors that impact on MSK problems
There are two maps for each of the factors that can impact on musculoskeletal
Low health literacy (colour)
This map shows the proportion of people in each area are considered to have low health literacy; that is these are people who need help to read instructions, pamphlets, or other written material from their doctor or pharmacy more than some of the time that they receive these. This ranges from 2.8% to 21.2%. On the map the lighter yellow areas are where there are around 1 in 30 who need help. In the darkest orange areas around 1 in 5 people need help to read instructions, pamphlets or other written material from their doctor or pharmacy more than some of the time that they receive these.

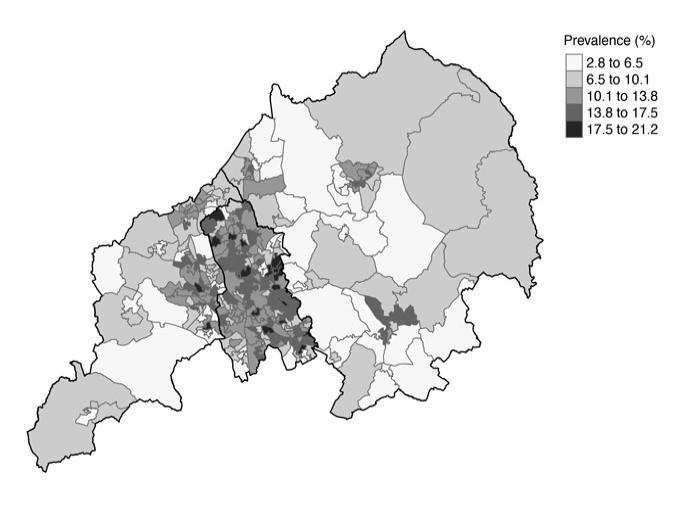
Low health literacy (grey)
This extra version of the map is tailored to show the difference in low health literacy between neighbourhoods more clearly. Low health literacy is most common in the areas shaded in the darkest grey. Low health literacy is least common in the areas shaded in the lightest grey.

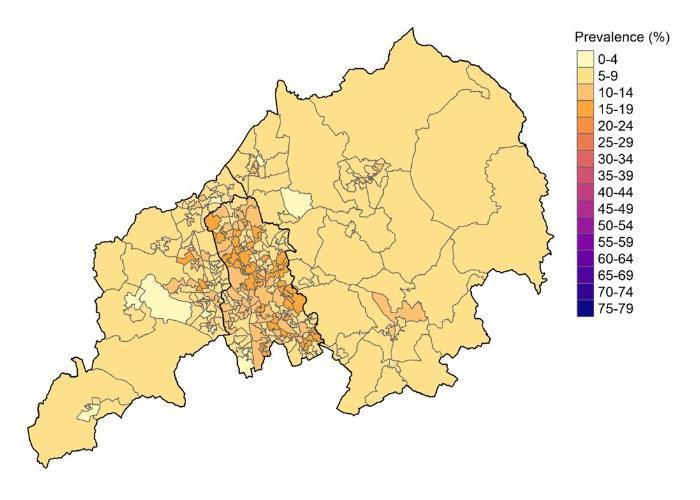
Low confidence in managing joint or muscle pain (colour)
- This map shows the proportion of people in each area who have low confidence in managing joint or muscle symptoms by themselves. This ranges from 2.9% to 19.4%. On the map the lighter yellow areas are where there are between 1 in 35 to 1 in 25 people who have low confidence. In the darkest orange areas between 1 in 6 and 1 in 5 people have low confidence to manage their joint or muscle symptoms.

Low confidence in managing joint or muscle pain (grey)
This extra version of the map is tailored to show the difference in low confidence manging joint or muscle symptoms between neighbourhoods more clearly. Low confidence managing these symptoms is most common in the areas shaded in the darkest grey. Low confidence managing these symptoms is least common in the areas shaded in the lightest grey.

Low understanding of joint and muscle pain (colour)
- This map shows the proportion of people in each area who have low understanding of the joint or muscle symptoms and condition and how this may be being treated (including the diagnosis and medication). This ranges from 5.8% to 25.2%. On the map the lighter yellow areas are where there between 1 in 20 to 1 in 10 people who have low understanding. In the darkest orange areas around 1 in 4 people have low understanding of their joint or muscle symptoms and condition.

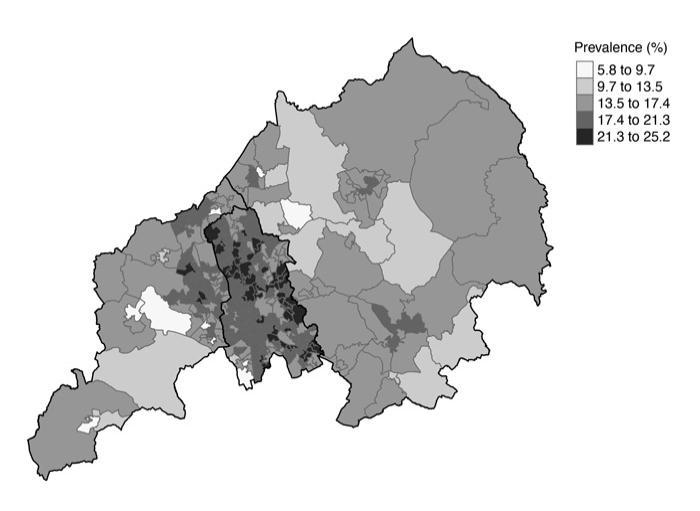
Low understanding of joint and muscle pain (grey)
This extra version of the map is tailored to show the difference in low understanding of joint or muscle symptoms and condition between neighbourhoods more clearly. Low understanding is most common in the areas shaded in the darkest grey. Low understanding is least common in the areas shaded in the lightest grey.


