Informal care
There are two maps for any informal care and moderate to heavy informal care. The
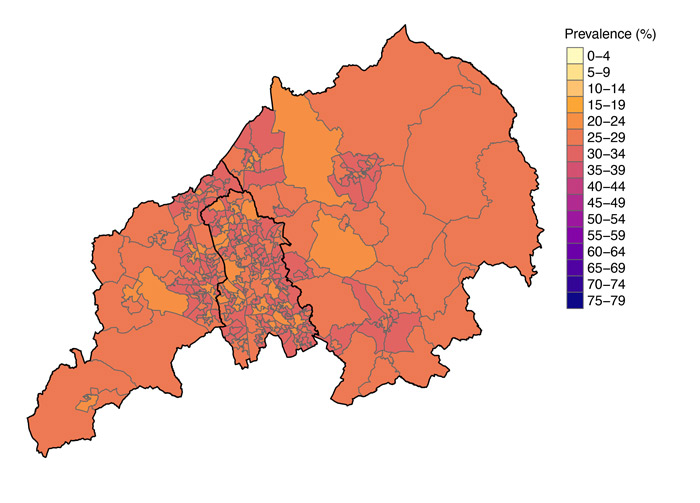
Informal care (any amount of time spent on informal care) (colour)
- This map shows the proportion of people in each area who look after, or give any help or support to family members, friends, neighbours or others because of a long term health problem or disability for 20 or more hours per week. This ranges from 3.6% to 9.9%. On the map the lighter yellow areas are where there are around 1 in 25 people provide help and support for 20 or more hours per week for someone who has a long term health problem or disability. In the darker yellow areas between 1 in 20 and 1 in 10 people provide help and support.

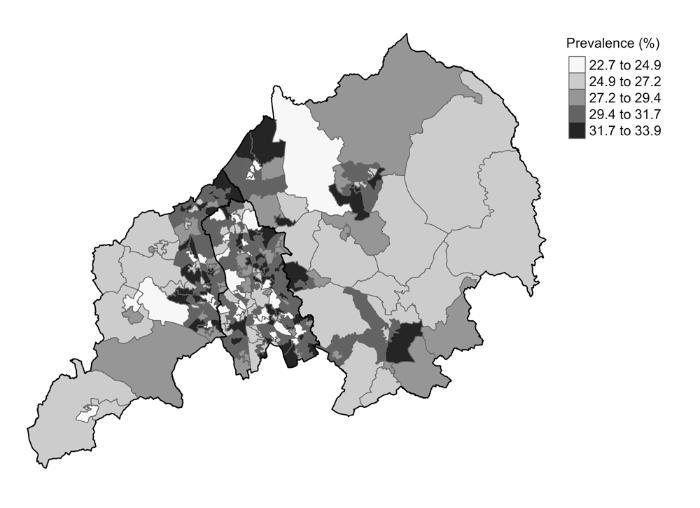
Informal care (any amount of time spent on informal care) (grey)
- This extra version of the map is tailored to show the difference in the proportion of people providing 20 hours or more per week of informal care between neighbourhoods more clearly. Providing 20+ weekly hours of informal care is most common in the areas shaded in the darkest grey. Providing 20+ weekly hours of informal care is least common in the areas shaded in the lightest grey.

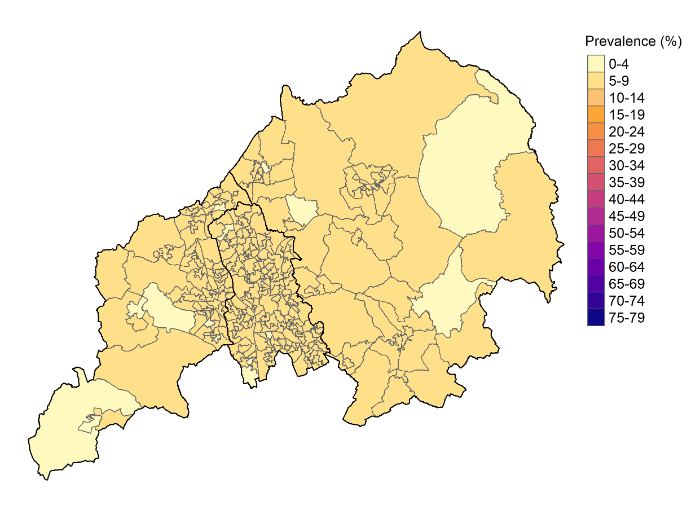
Informal care (moderate to heavy amount of informal care) (colour)
- This map shows the proportion of people in each area who look after, or give any help or support to family members, friends, neighbours or others because of a long term health problem or disability for 20 or more hours per week. This ranges from 3.6% to 9.9%. On the map the lighter yellow areas are where there are around 1 in 25 people provide help and support for 20 or more hours per week for someone who has a long term health problem or disability. In the darker yellow areas between 1 in 20 and 1 in 10 people provide help and support.

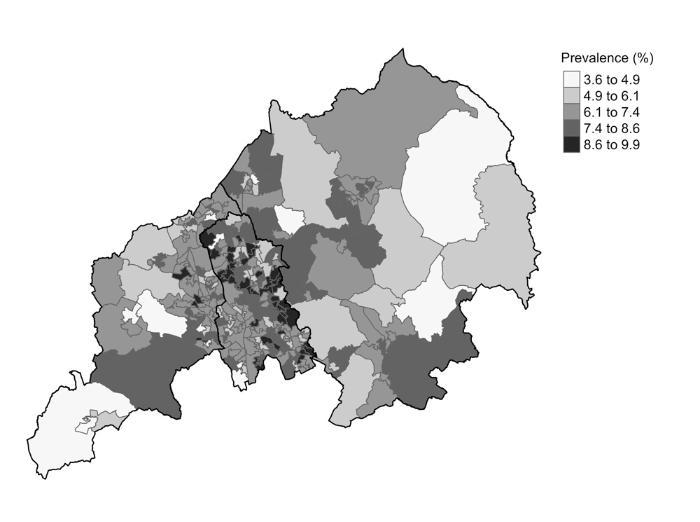
Informal care (moderate to heavy amount of informal care)
- This map shows the proportion of people in each area who look after, or give any help or support to family members, friends, neighbours or others because of a long term health problem or disability for 20 or more hours per week. This ranges from 3.6% to 9.9%. On the map the lighter yellow areas are where there are around 1 in 25 people provide help and support for 20 or more hours per week for someone who has a long term health problem or disability. In the darker yellow areas between 1 in 20 and 1 in 10 people provide help and support.


